Naturally Aspirated Combustion Data
The following graphs display data collected from a naturally aspirated 400 + cubic inch, high compression (> 14:1) racing engine operating on racing gas. The data below was generated after partial optimization of the engine using a TFX Engine Technology Inc. in-car system on the dyno. Combustion cycles, air fuel mixture burn rates and cycle to cycle variation in combustion are quite good and can be used as a guide for tuning many naturally aspirated racing engines. Additional tuning was carried out by the customer but is regarded as proprietary and as such cannot be displayed on this website.
The data below represents only a small sample of the various data graphs produced after each test. The software generates graphs summarizing the overall test in terms of HP, torque, combustion pressure, location of peak combustion pressure relative to TDC, volumetric efficiency etc. The software also generates graphs for each and every combustion and non combustion cycle during the test, displaying pressure vs. crank angle, air/fuel burn rates vs. crank angle and numerical data such as HP for each combustion cycle, peak combustion pressure/location, amount of energy released and how efficiently it was applied, etc.
s
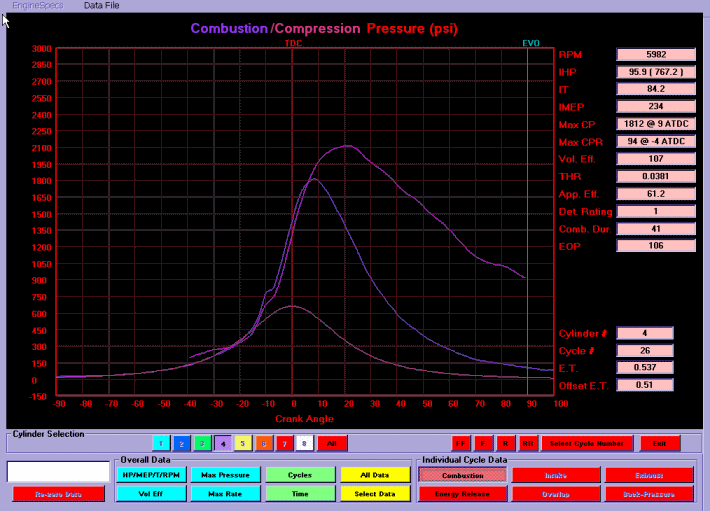
Combustion Pressure
In the graph above the lower pink line shows the pressure that would have existed in cylinder 4 if the spark had not ignited the air fuel (AF) mixture. The purple line shows the actual pressure in cylinder 4 which was developed as a result of the AF mixture combustion. The upper pink line indicates combustion temperature in Celcius.
Peak combustion pressure is 1812 psi at 9 ATDC for this combustion cycle. The combustion process is smooth and no detonation is observed as indicated by the smooth pressure trace without detonation spikes. For this cycle 96 HP (84 ft.lb. of torque) was made by cylinder 4 at 5982 rpm. If all cylinders had exactly the same combustion process the engine would make 767 IHP at 5982 rpm. On this cycle the volumetric efficiency (cylinder filling) was 107 % and the pressure in the cylinder was 106 psi when the exhaust valve started to open. This particular combustion cycle, although not fully optimized, is considered to be quite good for a naturally aspirated engine of this type.

Air Fuel (AF) Mixture Burn Rates
The burn rate or energy release rate of the combustion process for cylinder 4 (combustion cycle 26) is displayed above. The purple line indicates how quickly the AF mixture is burning relative to crank position and the pink line indicates the percentage of the AF mixture that has been combusted relative to crank position. For this combustion cycle 35 % of the AF mixture is combusted at TDC, 70 % at 10 ATDC, 88 % at 20 ATDC and 100% near 40 ATDC. Improvements could be made (and in fact were made but are proprietary to the customer) to the burn rate in terms of location relative to TDC to generate more power. However as previously mentioned, compared to many naturally aspirated racing engines the AF burn rates are pretty good.
Maximum Combustion Pressure
Cycle to Cycle Variation
The upper graph indicates the peak combustion pressure (purple line) for each combustion cycle (cylinder 4) and the white line indicates engine rpm (right side scale). During the engine test peak combustion pressures fluctuated on average +/-10% from the mean. Compared to many racing engines this is very good. Further efforts to reduce cycle to cycle variation in maximum combustion pressure from within each cylinder as well as from cylinder to cylinder would result in increased power, reduced stresses and less potential for detonation.
The lower graph indicates where peak combustion pressure occurred relative to TDC for each combustion cycle. The location of peak combustion pressure fluctuates between 5 ATDC and 10 ATDC. For this engine attempting to have the peak combustion pressure occur at the so called ideal location of 14-15 ATDC would result in a substantial loss in power.
Torque vs. RPM
Cycle to Cycle Variation
Engine torque for cylinder 4 is indicated by the purple lines and engine rpm is indicated by the white line (right side scale). For most of the engine speed range the torque fluctuation is on the order of +/-2 % on a cycle to cycle basis. From 6300 to 6500 rpm the fluctuation increases to +/-7% indicating engine conditions which caused unstable combustion. A +/- 2% cycle by cycle fluctuation in torque is very good and most engines will have a greater fluctuation. Fluctuation in torque from one cylinder to the next can be substantially greater.
Volumetric Efficiency (Cylinder Filling)
Variation with RPM and Cycle to Cycle
The purple line indicates how full of AF mixture the cylinder is and is referred to as volumetric efficiency in percent. The white line indicates the engine RPM (right side scale). The volumetric efficiency (VE) is highest around 5800 rpm averaging near 110 % and drifts down gradually to about 102% at 7000 rpm. At higher rpm (not shown) the VE would decrease rapidly as the intake/exhaust/porting/camshaft combination is no longer optimized. Significant gains in power can be made by increasing the VE of the engine. A 1 % increase in VE generates more than a 1% increase in torque/HP. An increase in VE results in an increase in AF mixture and an increase in thermal efficency, thereby generating more than 1% more torque/HP. Generally it is difficult to exceed about 120 % VE with a naturally aspirated engine.
Areas for Improvement (Combustion)
- Stabilize the combustion process throughout the entire test
- Equalize the combustion process in each cylinder
- Reduce cycle to cycle variation in the combustion process
- Maximize the number of good combustion cycles
- Further optimize the good combustion cycles to generate more torque
- Extend the rpm range where good combustion can occur.
Return to Top
Last Updated by TFX Jan 27, 2023
Site design © Todd Paton Web Design |